
Diagnostic performance of quantitative flow ratio for coronary artery stenosis: A meta-analysis
-
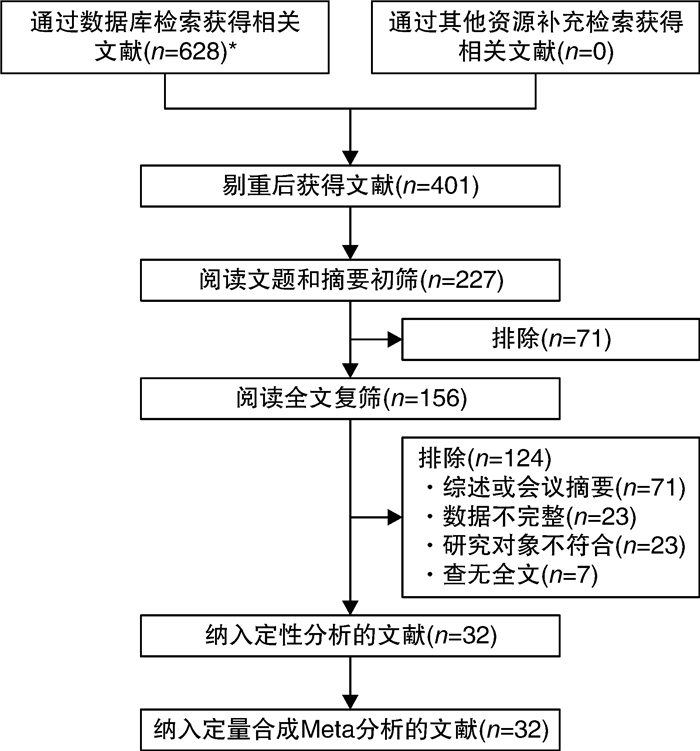
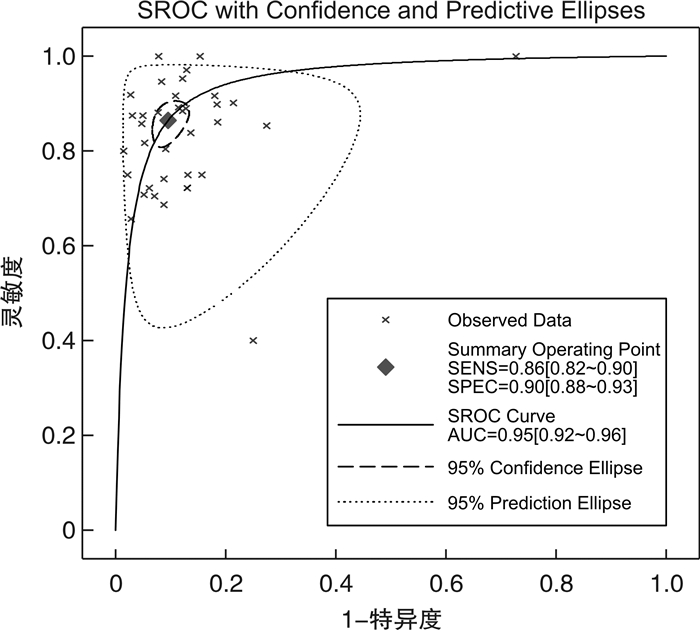
摘要: 目的 通过meta分析评价基于冠状动脉造影(CAG)的造影剂血流模型定量血流分数(cQFR)对冠状动脉狭窄的诊断效果。方法 通过对6个数据库[PubMed、EMbase、The Cochrane Library、CNKI、万方数据库和中国生物医学文献数据库(CBM)]的检索、文献数据摘录和meta分析(包括meta回归分析),评价cQFR的诊断效果。结果 共纳入32个研究,包括7 209支血管。Meta分析显示,当冠状动脉血管中度狭窄时,cQFR诊断冠状动脉狭窄的总体灵敏度和总体特异度分别为0.86(95%CI 0.82~0.90)和0.91(95%CI 0.88~0.93),总体诊断比值比为60.22(95%CI 43.00~84.34),综合受试者工作特征曲线下面积为0.95(95%CI 0.92~0.96)。结论 cQFR对冠状动脉狭窄的诊断效果良好,与血流储备分数相比,其为无创性的检测且费用相对较低,因此具有良好的临床应用前景。Abstract: Objective To evaluate the diagnostic performance of contrast-flow quantitative flow ratio(cQFR) for coronary artery stenosis based on coronary arteriography(CAG).Methods Six database[PubMed, The Cochrane Library, EMbase, CNKI, WanFang Data and Chinese BioMedical Literature Database(CBM)]search, relevant data extraction and Meta analyses(including Meta regression analysis) were conducted to assessing the diagnostic performance of cQFR in coronary artery stenosis.Results Totally 35 studies were included with 7 209 vessels. Random Meta analyses showed that the pooled sensitivity, pooled specificity, pooled diagnostic odds ratio of cQFR and the area under the summary receiver operating characteristic curve were 0.86(95%CI0.82-0.90), 0.91(95%CI0.88-0.93), 60.22(95%CI43.00-84.34) and 0.95(95%CI0.92-0.96) when coronary artery stenosis of a branch occupies no more than 80%.Conclusion cQFR has good diagnostic performance for coronary artery stenosis. Compared to fraction flow reserve(FFR), cQFR is noninvasive and less expensive, and therefore, has good clinical application prospect.
-

-
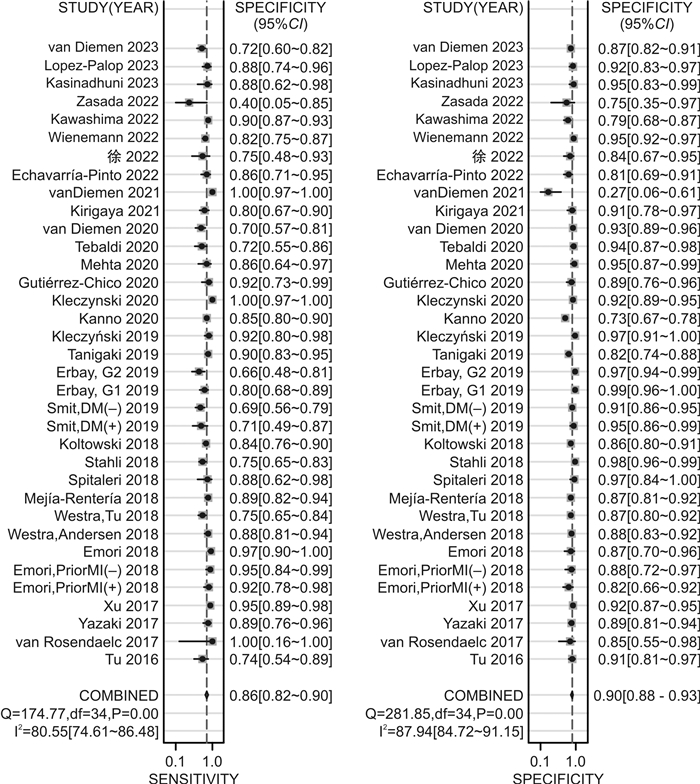
图 3 cQFR诊断冠状动脉狭窄病变Sen和Spe的森林图
Figure 3. The Forest plot of sensitivity and specificity of cQFR in diagnosing coronary artery stenosis lesions
表 1 纳入文献的基本特征
Table 1. Basic characteristics of included studies
项目 篇数 百分比
(%)项目 篇数 百分比
(%)年份 研究类型 2016 1 3.13 前瞻性 15 46.88 2017 3 9.38 回顾性 17 53.13 2018 8 25.00 小计 32 100.00 2019 4 12.50 研究设计 2020 6 18.75 单中心 22 68.75 2021 2 6.25 多中心 10 31.25 2022 5 15.63 小计 32 100.00 2023 3 9.38 金标准 小计 32 100.00 基于导丝的FFR 32 100.00 所在国家 日本 6 18.75 小计 32 100.00 荷兰 5 15.63 FFR界值 波兰 4 12.50 ≤0.08 32 100.00 中国 3 9.38 小计 32 100.00 西班牙 3 9.38 QFR界值 德国 3 9.38 ≤0.08 32 100.00 意大利 2 6.25 小计 32 100.00 丹麦 2 6.25 其他 4 12.50 小计 32 100.00  下载: 导出CSV
表 2 患者的基本特征
Table 2. Basic characteristics of patients
X±S, M(P25, P75) 文献 基本特征 高危因素/例(%) 患者/血管
(例/支)年龄/岁 男/例
(%)BMI/(kg/m2) 吸烟 高血压 高脂血症 糖尿病 Tu 2016[6] 73/84 65.8±8.9 61(83.5) 26.3±6.3 32(43.8) 17(27.4 van Rosendaelc 2017[8] 17/15 64±11 12(71) 27.7±5.3 3(18) 11(65) 9(53) 1(6) Yazaki 2017[9] 142/151 72.5±9.5 100(70.4) 23.9±3.2 33(23.2) 101(71.1) 88(62.0) 41(28.9 Xu 2017[10] 308/332 61.3±10.4 227(73.7) 25.2±3.3 87(28.2) 185(60.1) 139(45.1) 86(27.9 Emori,Prior MI(+)2018a[11] 75/75 69±9 62(83) 17(23) 61(81) 45(60) 34(45) Emori,Prior MI(-)2018a[11] 75/75 70±9 54(72) 23(31) 64(85) 46(61) 36(48) Emori 2018[12] 100/100 70±10 71(71) 21(21) 73(73) 58(58) 48(48) Westra 2018[13] 272/317 67±10 196(72) 27±5 156(57) 201(74) 186(68) 78(29) Westra 2018[14] 172/255 61±8 116(67) 27±4 101(59) 121(70) 18(10) Mejía-Rentería 2018[15] 248/300 64.2±10.3 188(76) 26.2
(24.6,29.0)56(23) 164(66) 143(58) 94(38) Spitaleri 2018[16] 45/49 62±11 36(80) 28±5 19(45) 29(64) 23(51) 4(9) St?hli 2018[17] 436/516 71.5
(63.0,77.0)296(67.9) 26.0
(23.9,29.2)148(34) 383(87.8) 345(79.1) 98(22.5 Ko?towski 2018[18] 268/306 66.3±9.98 193(72) 28(10.4) 203(75.7) 75(28) Smit,DM(+)2019b[19] 66/82 67±9 47(71) 60(91) Smit,DM(-)2019b[19] 193/238 67±9 134(69) 130(68) Erbay,G1 2019c[20] 225/270 71.0
(63.0,77.5)142(63.1) 26.2
(24.1,28.7)193(85.8) 176(78.2) 49(21.8 Erbay,G2 2019c[20] 221/246 72.0
(64.0,77.0)154(73.0) 26.0
(23.8,29.4)190(90.0) 169(80.1) 49(23.2 Tanigaki 2019[21] 152/233 69±9 98(64) 59(39) 99(65) 80(53) 46(30) Kleczyński 2019[22] 50/123 66.0±9.3 36(72) Kanno 2020[23] 504/504 66.9±9.4 88(17.5) 116(23.0) 352(69.8) 316(62.7) 210(41.7) Kleczynski 2020[24] 221/416 82.0
(74.0,88.0)91(41.2) 27.0
(23.9,30.0)71(32.1) 197(89.1) 121(100.0) 68(30.8 Gutiérrez-Chico 2020[25] 59/75 63.4±10.1 50(84.7) 28.1
(25.4,30.6)17(28.8) 40(67.8) 31(52.5) 23(39.0 Mehta 2020[26] 47/85 65.1±10.1 29(61.7) 22(46.8) 27(57.4) 11(23.4) Tebaldi 2020[27] 116/184 70(44,85) 87(75) 30.4
(18.73,81.93)34(29) 89(77) 66(57) 31(27) van Diemen 2020[28] 169/286 58±9 101(60) 27.0±3.6 79(47) 83(49) 29(17) Kirigaya 2021[29] 77/95 70±9 62(81) 13(17) 46(60) 43(56) 34(44) van Diemen 2021[30] 115/134 64.9±9.9 89(77) 26.7±3.8 69(60) 61(53) 18(16) EchavarríaPinto 2022[31] 66/90 66.1±8.8 47(71.2) 12(18.7) 55(84.6) 31(47.7 徐2022[32] 48/48 61.89±9.18 30(62.50) 17(35.42) 32(66.67) 5(10.42) 12(25.00 Wienemann 2022[33] 544/626 69.5
(61.3,77.0)392(72.0) 27.7±4.8 101(18.6) 398(73.3) 280(51.6) 146(26.9 Kawashima 2022[34] 183/469 67.0±8.9 159(86.9) 26.4±3.6 122(63.2) 133(72.7) 121(66.1) 66(36.0 Zasada 2022[35] 12/13 73.8±7.5 6(50) Kasinadhuni 2023[36] 53/56 62.4±9.1 43(81.1) 8(15.1) 36(67.9) 12(22.6) 21(39.6 Lopez-Palop 2023[37] 81/107 70±9.6 62(76.5) 28.0±3.9 42(51.9) 58(71.6) 55(67.9) 31(38.3 van Diemen 2023[38] 166/334 63.1±9.3 130(78) 27.3±4.2 93(56) 105(63) 35(21) a Emori 2018同一篇文献研究对象分为既往有或无心肌梗死两组患者;b Smit 2019同一篇文献研究对象分为既往有或无糖尿病两组患者;c Erbay 2019同一篇文献研究对象分为血管直径≤2.8 mm和血管直径>2.8 mm两组患者。下同。
下载: 导出CSV
表 3 血管的基本特征
Table 3. Basic characteristics of vessels
X±S, M(P25, P75) 文献 血管数/支 部分病变位置/例(%) 病变指标 左前降支 左回旋支 右冠状动脉 最小管腔直径/mm 参考血管直径/mm 直径狭窄率/% 病变长度/mm Tu 2016[6] 84 46(54.8) 12(14.3) 19(22.6) 1.52±0.36 2.84
(2.57,3.06)46.1±8.9 van Rosendaelc 2017[8] 15 12(80) 3(20) 0(0) 38.7±8.6 15.4±7.7 Yazaki 2017[9] 151 96(63.6) 25(16.6) 26(17.2) 1.38±0.39 2.84±0.57 48.8±8.2 16.8
(12.1,24.6)Xu 2017[10] 332 185(55.7) 49(14.8) 87(26.2) 1.51±0.44 2.82±0.56 46.5±11.3 13.1±6.4 Emori,Prior MI(+)2018a[11] 75 48(64) 5(7) 22(29) 1.27±0.06 2.71±0.06 53±14 20.2±9.6 Emori,Prior MI(-)2018a[11] 75 49(65) 12(16) 14(19) 1.30±0.06 2.79±0.06 54±14 20.2±9.9 Emori 2018[12] 100 63(63) 23(23) 14(14) 1.19±0.39 2.62±0.55 55±10 22.6±12.4 Westra 2018[13] 317 160(50) 50(16) 68(22) 1.57
(1.27,1.90)2.82
(2.44,3.20)45±10 9.64
(7.53,13.76)Westra,Tu 2018[14] 255 129(51) 29(11) 46(18) Mejía-Rentería 2018[15] 300 177(59.0) 37(12.3) 49(16.3) 1.30
(1.00,1.60)2.80±0.57 52±12 75.9±22.4 Spitaleri 2018[16] 49 St?hli 2018[17] 516 287(55.6) 67(13.0) 119(23.1) 1.7(1.4,1.9) 2.8(2.5,3.2) Ko?towski 2018[18] 306 174(56.9) 81(26.5) 51.3±10.2 Smit,DM(+)2019b[19] 82 55(67) 13(16) 9(11) 1.6±0.3 42.7±8.9 20.8
(11.9,31.8)Smit,DM(-)2019b[19] 238 161(68) 33(14) 24(10) 1.6±0.3 43.3±8.5 20.0
(12.7,28.6)Erbay,G1 2019c[20] 270 157(58.1) 35(13.0) 1.4(1.3,1.6) 2.5(2.3,2.7) 41.4
(36.4,47.6)17.0
(11.7,24.0)Erbay,G2 2019c[20] 246 130(52.8) 84(34.1) 1.9(1.7,2.1) 3.3(3.0,3.6) 41.4
(36.4,45.7)17.2
(12.1,25.9)Tanigaki 2019[21] 233 132(56) 53(23) 48(21) 1.38±0.46 20.4±9.8 Kleczyński 2019[22] 123 48(39) 44.2±11.7 Kanno 2020[23] 504 348(69.0) 100(19.8) 1.4(1.1,1.7) 2.8(2.5,3.1) 49.6±12.0 18.4
(13.1,24.0)Kleczynski 2020[24] 416 190(45.7) 88(21.2) 1.5±0.5 3.4±0.6 58.6±13.4 18.5±9.9 Gutiérrez-Chico 2020[25] 70 39(52.0) 4(5.3) 23(30.7) Mehta 2020[26] 85 38(44.7) 15(17.6) 17(20.0) 35.3±14.7 11.9±10.2 Tebaldi 2020[27] 184 100(54) 44(24) 40(22) 2.7(2.5,3.4) 62(55,75) 21(13,25) van Diemen 2020[28] 286 122(43) 77(27) 1.7±0.6 37±16 18±13 Kirigaya 2021[29] 95 61(64) 17(18) 17(18) 1.42±0.38 2.82±0.61 49.2±8.6 20.3±10.8 van Diemen 2021[30] 134 70(52) 33(25) 0.98±0.36 64±12 EchavarríaPinto 2022[31] 90 48(53.3) 19(21.1) 13(14.4) 1.5±0.5 2.9±0.6 46.6±12.8 17.2
(10.9,30.5)徐2022[32] 48 26(54.17) 5(10.42) 17(35.42) 47.2±11.2 Wienemann 2022[33] 626 385(61.5) 126(20.1) 1.5(1.3,1.8) 44.5±7.5 18.5
(12.3,26.1)Kawashima 2022[34] 469 190(40.5) 143(30.5) 136(29.0) 2.75±0.64 Zasada 2022[35] 13 12(92) Kasinadhuni 2023[36] 56 28(50) 15(26.8) 12(21.5) 1.35±0.33 3.2±0.37 45.25±11.22 20.8±12.4 Lopez-Palop 2023[37] 107 1.86±0.40 3.59±1.67 45.88±8.80 13.35±6.92 van Diemen 2023[38] 334 127(38) 93(28) 1.7±0.5 41±14 16.3
(10.5,26.2)
下载: 导出CSV
表 4 血管的诊断特征
Table 4. Diagnostic characteristics of vessels
文献 QFR测量成功的血管数/支 准确率/% Sen/% Spe/% 阳性预测值/% 阴性预测值/% AUC Tu 2016[6] 84 86(78~93) 74(54~89) 91(81~97) 80(59~93) 88(77~95) 0.92(0.85~0.97) van Rosendaelc 2017[8] 15 86.7 100.0 84.6 50.0 100.0 Yazaki 2017[9] 151 88.7 89.1 88.6 77.4 94.9 0.93 Xu 2017[10] 328 92.7
(89.3~95.3)94.6
(88.7~98.0)91.7
(87.1~95.0)85.5
(78.0~91.2)97.1
(93.7~98.9)0.96
(0.94~0.98)Emori,Prior MI(+)2018a[11] 75 87(77~92) 92(82~97) 82(73~87) 83(74~87) 91(82~97) 0.93(0.86~0.97) Emori,Prior MI(-)2018a[11] 75 92(84~96) 95(88~99) 88(79~92) 91(84~94) 94(84~98) 0.97(0.93~0.99) Emori 2018[12] 100 94(88~97) 97(92~99) 87(77~92) 94(90~96) 93(82~98) Westra 2018[13] 317 86.8 86.5
(78.4~92.4)86.9
(81.6~91.1)76.3
(67.6~83.6)93.0
(88.5~96.1)0.92(0.89~0.96) Westra,Tu 2018[14] 240 83 77(66~85) 86(79~91) 75(65~84) 87(80~92) 0.86(0.81~0.91) Mejía-Rentería 2018[15] 300 88.0 89(83~94) 87(80~91) 85(79~89) 91(86~94) 0.93(0.90~0.96) Spitaleri 2018[16] 49 94 88 97 94 94 0.96(0.89~0.99) St?hli 2018[17] 516 93.4
(90.9~95.4)75.0
(65.3~83.1)97.8
(95.9~99.0)89.3
(81.2~94.1)94.2
(92.1~95.8)0.86(0.83~0.89) Ko?towski 2018[18] 306 85.4(78.7~89.5) 83.8 86.6 82.2 87.9 0.94(0.91~0.97) Smit,DM(+)2019b[19] 82 88(79~94) 71(49~87) 95(86~99) 85(65~95) 89(81~94) 0.91(0.84~0.99) Smit,DM(-)2019b[19] 238 85(79~89) 69(56~79) 91(85~95) 74(64~83) 88(84~91) 0.93(0.89~0.96) Erbay,G1 2019c[20] 270 94.1
(90.6~96.6)80.0
(68.2~88.9)98.5
(95.8~99.7)94.6
(84.9~98.2)94.0
(90.5~96.2)0.98(0.96~0.99) Erbay,G2 2019c[20] 246 92.7
(88.7~95.6)65.7
(47.8~80.9)97.2
(93.9~99.0)79.3
(62.7~89.7)94.5
(91.5~96.4)0.97(0.94~0.99) Tanigaki 2019[21] 233 85(81~89) 90(85~94) 82(77~85) 81(76~84) 90(85~94) 0.93 Kleczyński 2019[22] 123 95.1 91.8 97.3 95.7 94.7 0.98(0.94~1.00) Kanno 2020[23] 504 78.6 85.3 72.6 73.6 84.6 0.84(0.81~0.88) Kleczynski 2020[24] 416 94.2
(91.5~96.3)100.0
(96.6~100.0)92.2
(88.6~94.9)81.8
(75.4~86.9)100 Gutiérrez-Chico 2020[25] 70 90(83~97) 91(72~99) 89(77~97) 81(61~93) 96(85~99) 0.91 Mehta 2020[26] 85 93 86 95 86 95 Tebaldi 2020[27] 134 88 72 94 82 90 0.964(0.903~0.974) van Diemen 2020[28] 286 88(84~92) 70(57~81) 93(89~96) 73(62~82) 92(89~94) 0.94(0.91~0.97) Kirigaya 2021[29] 95 85.2 80.4 91 91.1 80 van Diemen 2021[30] 128 94(88~97) 100(97~100) 27(6~61) 94(91~95) 100 EchavarríaPinto 2022[31] 90 83.3 85.2 80.6 75.6 89.8 0.92(0.86~0.97) 徐2022[32] 48 81.3
(71.3~91.2)75.0
(62.3~92.3)84.4
(73.0~95.2)70.6
(62.3~96.6)87.1
(75.2~94.7)0.862
(0.824~0.931)Wienemann 2022[33] 626 91
(88.2~92.9)82
(75.5~86.9)95
(92.2~96.6)87
(81.3~91.7)92
(89.3~94.5)0.938
(0.917~0.961)Kawashima 2022[34] 469 88.3 90.1 78.7 95.7 60.2 Zasada 2022[35] 13 61.5 40.0 75.0 50.0 66.7 Kasinadhuni 2023[36] 56 92.8 87.5 95 87.5 95 0.97(0.94~1.00) Lopez-Palop 2023[37] 107 90.7
(83.5~95.4)88.1
(75.0~94.8)92.3
(83.2~96.7)88.1
(77.1~99.1)92.3
(85.1~99.5)0.93(0.88~0.98) van Diemen 2023[38] 334 84(80~88) 72(61~81) 87(83~91) 61(50~71) 92(88~95)
下载: 导出CSV
表 5 纳入文献的meta分析结果
Table 5. Meta analysis results of included literature
项目 估计值(95%CI) I2(%)(95%CI) Cochrane Q(P值) Sen总体 0.864(0.822~0.897) 80.55(74.61~86.48) 174.77(0.00) Spe总体 0.905(0.876~0.927) 87.94(84.72~91.15) 281.85(0.00) +LR总体 9.055(7.043~11.642) 86.90(86.90~92.23) 325.86(0.00) -LR总体 0.150(0.116~0.196) 78.65(71.96~85.34) 159.23(0.00) DOR总体 60.222(43.000~84.343) 100.00(100.00~100.00) 2.4e+16(0.00) 总体 98.80(98.17~99.43) 166.772(0.000)
下载: 导出CSV
表 6 cQFR诊断比值比对数的meta回归结果
Table 6. Meta analysis results of cQFR's DOR
变量 估计值(95%CI) 标准误差 P值 截距 4.316 5(3.640 5~4.992 5) 0.331 9 < 0.000 1 血管数≥150支(1:是,0:否) -0.220 6(-0.858 8~0.417 5) 0.313 3 0.486 3 2019年及以后发表(1:是,0:否) -0.373 0(-1.009 2~0.263 3) 0.312 4 0.241 3 采用多层线性回归模型,方法为REML;权重为DOR对数方差的倒数,控制了各项目间的随机效应。
下载: 导出CSV
-
[1] 国家卫生健康委员会. 2022中国卫生健康统计年鉴[M]. 北京: 中国协和医科大学出版社, 2021.
[2] 观研天下. 中国PCI手术器械市场竞争现状分析与投资战略调研报告(2023-2030年)[R/OL].
[3] Jeremias A, Kirtane AJ, Stone GW, et al. A test in context: fractional flow reserve: accuracy, prognostic implications, and limitations[J]. J Am Coll Cardiol, 2017, 69(22): 2748-2758. doi: 10.1016/j.jacc.2017.04.019
[4] 王德广, 刘猛, 马越, 等. 冠状动脉功能学评价研究进展[J]. 中国医药, 2019, 14(6): 945-947. doi: 10.3760/j.issn.1673-4777.2019.06.035
[5] 赵国力, 尹德录, 姚月明. 定量血流分数的临床应用与进展[J]. 临床心血管病杂志, 2023, 39(11): 831-835. https://lcxxg.whuhzzs.com/article/doi/10.13201/j.issn.1001-1439.2023.11.003
[6] Tu S, Westra J, Yang J, et al. Diagnostic accuracy of fast computational approaches to derive fractional flow reserve from diagnostic coronary angiography: the international multicenter FAVOR pilot study[J]. JACC Cardiovasc Interv, 2016, 9(19): 2024-2035. doi: 10.1016/j.jcin.2016.07.013
[7] Bradley AP. The use of the area under the ROC curve in the evaluation of machine learning algorithms[J]. Pattern Recognition, 1997, 30(7): 1145-1159. doi: 10.1016/S0031-3203(96)00142-2
[8] van Rosendael AR, Koning G, Dimitriu-Leen AC, et al. Accuracy and reproducibility of fast fractional flow reserve computation from invasive coronary angiography[J]. Int J Cardiovasc Imaging, 2017, 33(9): 1305-1312. doi: 10.1007/s10554-017-1190-3
[9] Yazaki K, Otsuka M, Kataoka S, et al. Applicability of 3-Dimensional quantitative coronary angiography-derived computed fractional flow reserve for intermediate coronary stenosis[J]. Circ J, 2017, 81(7): 988-992. doi: 10.1253/circj.CJ-16-1261
[10] Xu B, Tu S, Qiao S, et al. Diagnostic accuracy of angiography-based quantitative flow ratio measurements for online assessment of coronary stenosis[J]. J Am Coll Cardiol, 2017, 70(25): 3077-3087. doi: 10.1016/j.jacc.2017.10.035
[11] Emori H, Kubo T, Kameyama T, et al. Diagnostic accuracy of quantitative flow ratio for assessing myocardial ischemia in prior myocardial infarction[J]. Circ J, 2018, 82(3): 807-814. doi: 10.1253/circj.CJ-17-0949
[12] Emori H, Kubo T, Kameyama T, et al. Quantitative flow ratio and instantaneous wave-free ratio for the assessment of the functional severity of intermediate coronary artery stenosis[J]. Coron Artery Dis, 2018, 29(8): 611-617. doi: 10.1097/MCA.0000000000000650
[13] Westra J, Andersen BK, Campo G, et al. Diagnostic performance of in-procedure angiography-derived quantitative flow reserve compared to pressure-derived fractional flow reserve: The FAVOR Ⅱ Europe-Japan study[J]. J Am Heart Assoc, 2018, 7(14): e009603. doi: 10.1161/JAHA.118.009603
[14] Westra J, Tu S, Winther S, et al. Evaluation of coronary artery stenosis by quantitative flow ratio during invasive coronary angiography: The WIFI Ⅱ study(Wire-Free Functional Imaging Ⅱ)[J]. Circ Cardiovasc Imaging, 2018, 11(3): e007107. doi: 10.1161/CIRCIMAGING.117.007107
[15] Mejía-Rentería H, Lee JM, Lauri F, et al. Influence of microcirculatory dysfunction on angiography-based functional assessment of coronary stenosis[J]. JACC Cardiovasc Interv, 2018, 11(8): 741-753. doi: 10.1016/j.jcin.2018.02.014
[16] Spitaleri G, Tebaldi M, Biscaglia S, et al. Quantitative flow ratio identifies nonculprit coronary lesions requiring revascularization in patients with ST-segment-elevation myocardial infarction and multivessel disease[J]. Circ Cardiovasc Interv, 2018, 11(2): e006023. doi: 10.1161/CIRCINTERVENTIONS.117.006023
[17] Stähli BE, Erbay A, Steiner J, et al. Comparison of resting distal to aortic coronary pressure with angiography-based quantitative flow ratio[J]. Int J Cardiol, 2019, 279: 12-17. doi: 10.1016/j.ijcard.2018.11.093
[18] Kołtowski Ł, Zaleska M, Maksym J, et al. Quantitative flow ratio derived from diagnostic coronary angiography in assessment of patients with intermediate coronary stenosis: a wire-free fractional flow reserve study[J]. Clin Res Cardiol, 2018, 107(9): 858-867. doi: 10.1007/s00392-018-1258-7
[19] Smit JM, El Mahdiui M, van Rosendael AR, et al. Comparison of diagnostic performance of quantitative flow ratio in patients with versus without diabetes mellitus[J]. Am J Cardiol, 2019, 123(10): 1722-1728. doi: 10.1016/j.amjcard.2019.02.035
[20] Erbay A, Steiner J, Lauten A, et al. Assessment of intermediate coronary lesions by fractional flow reserve and quantitative flow ratio in patients with small-vessel disease[J]. Catheter Cardiovasc Interv, 2019, 96(4): 743-751.
[21] Tanigaki T, Emori H, Kawase Y, et al. QFR versus FFR derived from computed tomography for functional assessment of coronary artery stenosis[J]. JACC Cardiovasc Interv, 2019, 12(20): 2050-2059. doi: 10.1016/j.jcin.2019.06.043
[22] Kleczyński P, Dziewierz A, Rzeszutko L, et al. Is quantitative flow ratio enough to accurately assess intermediate coronary stenosis? A comparison study with fractional flow reserve[J]. Cardiol J, 2019, 26(6): 793-795.
[23] Kanno Y, Hoshino M, Hamaya RS, et al. Functional classification discordance in intermediate coronary stenoses between fractional flow reserve and angiography-based quantitative flow ratio[J]. Open Heart, 2020, 7(1): e001179. doi: 10.1136/openhrt-2019-001179
[24] Kleczynski P, Dziewierz A, Rzeszutko L, et al. Quantitative flow ratio for evaluation of borderline coronary lesions in patients with severe aortic stenosis[J]. Rev Esp Cardiol, 2020, 75(6): 472-478.
[25] Gutiérrez-Chico JL, Chen Y, Yu W, et al. Diagnostic accuracy and reproducibility of optical flow ratio for functional evaluation of coronary stenosis in a prospective series[J]. Cardiol J, 2020, 27(4): 350-361. doi: 10.5603/CJ.a2020.0071
[26] Mehta OH, Hay M, Lim RY, et al. Comparison of diagnostic performance between quantitative flow ratio, non-hyperemic pressure indices and fractional flow reserve[J]. Cardiovasc Diagn Ther, 2020, 10(3): 442-452. doi: 10.21037/cdt-20-179
[27] Tebaldi M, Biscaglia S, Erriquez A, et al. Comparison of quantitative flow ratio, Pd/Pa and diastolic hyperemia-free ratio versus fractional flow reserve in non-culprit lesion of patients with non ST-segment elevation myocardial infarction[J]. Catheter Cardiovasc Interv, 2021, 98(6): 1057-1065. doi: 10.1002/ccd.29380
[28] van Diemen PA, Driessen RS, Kooistra RA, et al. Comparison between the performance of quantitative flow ratio and perfusion imaging for diagnosing myocardial ischemia[J]. JACC Cardiovasc Imaging, 2020, 13(9): 1976-1985. doi: 10.1016/j.jcmg.2020.02.012
[29] Kirigaya H, Okada K, Hibi K, et al. Diagnostic performance and limitation of quantitative flow ratio for functional assessment of intermediate coronary stenosis[J]. J Cardiol, 2021, 77(5): 492-499. doi: 10.1016/j.jjcc.2020.11.002
[30] van Diemen PA, de Winter RW, Schumacher SP, et al. Residual quantitative flow ratio to estimate post-percutaneous coronary intervention fractional flow reserve[J]. J Interv Cardiol, 2021, 2021: 4339451.
[31] Echavarría-Pinto M, Van de Hoef TP, Pacheco-Beltran N, et al. Diagnostic agreement of quantitative flow ratio with fractional flow reserve in a Latin-American population[J]. Int J Cardiovasc Imaging, 2022, 38: 1423-1430. doi: 10.1007/s10554-022-02547-6
[32] 徐亚楠. 定量血流分数对冠状动脉临界病变患者心肌缺血的诊断价值[D]. 河北医科大学, 2022.
[33] Wienemann H, Ameskamp C, Mejía-Rentería H, et al. Diagnostic performance of quantitative flow ratio versus fractional flow reserve and resting full-cycle ratio in intermediate coronary lesions[J]. Int J Cardiol, 2022, 362: 59-67. doi: 10.1016/j.ijcard.2022.05.066
[34] Kawashima H, Kogame N, Ono M, et al. Diagnostic concordance and discordance between angiography-based quantitative flow ratio and fractional flow reserve derived from computed tomography in complex coronary artery disease[J]. J Cardiovasc Comput Tomogr, 2022, 16(4): 336-342. doi: 10.1016/j.jcct.2022.02.004
[35] Zasada W, Mikołajczyk F, Jᶒdrychowska M, et al. Comparison of FFR, iFR, and QFR assessment in patients with severe aortic stenosis and coronary heart disease[J]. Postepy Kardiol Interwencyjnej, 2022, 18(2): 118-121.
[36] Kasinadhuni G, Batta A, Gawalkar AA, et al. Validity and correlation of quantitative flow ratio with fractional flow reserve for assessment of intermediate coronary lesions[J]. Acta Cardiol, 2023, 78(1): 91-98. doi: 10.1080/00015385.2022.2059857
[37] Lopez-Palop R, Carrillo P, Leithold G, et al. Accuracy of the angiography-based quantitative flow ratio in intermediate left main coronary artery lesions and comparison with visual estimation[J]. Int J Cardiol, 2023, 383: 8-14.
[38] van Diemen PA, de Winter RW, Schumacher SP, et al. The diagnostic performance of quantitative flow ratio and perfusion imaging in patients with prior coronary artery disease[J]. Eur Heart J Cardiovasc Imaging, 2023, 25(1): 116-126.
[39] Zhang Y, Zhang S, Westra J, et al. Automatic coronary blood flow computation: validation in quantitative flow ratio from coronary angiography[J]. Int J Cardiovasc Imaging, 2019, 35(4): 587-595.
[40] Westra J, Tu S, Campo G, et al. Diagnostic performance of quantitative flow ratio in prospectively enrolled patients: An individual patient-data meta-analysis[J]. Catheter Cardiovasc Interv, 2019, 94(5): 693-701.
-
计量
- 文章访问数: 250
- 施引文献: 0