
Diagnosis of unstable angina pectoris based on CCTA radiomic of pericoronary adipose tissue
-
摘要: 目的 探究基于冠状动脉CT血管成像(CCTA)的冠状动脉周围脂肪组织(PCAT)影像组学结合临床及影像特征对稳定型心绞痛(SA)及不稳定型心绞痛(UA)的诊断价值。方法 回顾性分析187例心绞痛患者的临床影像资料,包括SA患者(92例)及UA患者(95例),按7∶3比例分为训练组(130例)及验证组(57例)。通过提取并筛选右冠状动脉(RCA)及左前降支(LAD)近端PCAT影像组学特征,且量化RCA近端脂肪衰减指数(FAI),建立FAI模型及3种影像组学模型[RCA、LAD、RCA联合LAD(联合模型)]。运用多因素logistic回归筛选临床影像资料并结合影像组学评分(Rad-score)建立综合模型,然后采用逻辑回归(LR)及随机森林(RF)两种分类器分别构建上述5种模型。以受试者工作特征(ROC)曲线评价模型的诊断效能,并结合校准曲线评估校准度。结果 RCA联合LAD近端PCAT共筛选9个最优影像组学特征用于计算Rad-score,糖化血红蛋白(HbA1b)、冠状动脉树中是否存在高危斑块(HRP)及Rad-score为诊断SA及UA的独立危险因素。与LR模型相比,RF模型鉴别性能更高且于验证组中具有统计学意义(P < 0.05)。在RF模型中,3种影像组学模型诊断效能无差异,但是综合模型训练组AUC 0.89,高于联合模型训练组AUC 0.86,P=0.004。校正曲线显示3种影像组学模型及综合模型的校准度良好。结论 基于CCTA的PCAT影像组学模型诊断UA优于FAI模型,将PCAT放射组学与临床及影像特征(HbA1b、HRP)相结合,可进一步提高UA的诊断能力。
-
关键词:
- 冠状动脉周围脂肪组织 /
- 影像组学 /
- 心绞痛 /
- 冠状动脉CT血管成像
Abstract: Objective To investigate the diagnostic value of radiomics analysis of pericoronary adipose tissue(PCAT) captured by coronary computed tomography angiography(CCTA) combined with clinical and imaging signature for stable angina(SA) and unstable angina(UA).Methods The clinical and CCTA imaging data of 187 patients with angina pectoris, comprising of 92 SA patients and 95 UA patients, were retrospectively analyzed. The patients were randomly divided into a training set(n=130) and a validation set(n=57) using a ratio of 7: 3. The fat attenuation index(FAI) model, three types of radiomics models[right coronary artery(RCA), left anterior descending artery(LAD), RCA combined with LAD(combined model) ]were established by extracting and screening the radiomics features based on the proximal PCAT of RCA and LAD, and quantifying the FAI of the proximal RCA. The comprehensive model was developed using multifactorial logistic regression analysis to screen clinical and imaging data, combined with Rad-score of the combined model. Two classifiers, logistic regression(LR) and random forest(RF), were used to construct each of the above five models. The discriminative performance of the model was evaluated by receiver operating characteristic(ROC) curves, and the calibration curve was used to evaluate its calibration degree.Results The RCA combined with the LAD proximal PCAT screened 9 optimal radiomics features to calculate Rad-scores, among which glycated hemoglobin A1c(HbA1c), presence of high-risk plaques in the coronary tree(HRP) and Rad-scores were independent risk factors for diagnosing SA from UA. The RF model had higher discriminatory performance than the LR model and was statistically significant in the validation group(both P < 0.05). Among the five models established with the classifier as RF, the area under the curve(AUC) of three radiomics models and the comprehensive model were higher than those of the FAI model(both P < 0.05). However, there was no significant difference in AUC among the three radiomics models. The AUC of the comprehensive model training set(0.89) was higher than the AUC of the combined model(0.86, P=0.004). The calibration curve showed that three types of radiomics models and the comprehensive model were well calibrated.Conclusion The CCTA-based PCAT radiomic model is superior to the FAI model for diagnosing UA. Combining PCAT radiomics with clinical and imaging features(HbA1b, HRP) can further improve the diagnosis of UA. -

-
表 1 SA组和UA组的临床及影像特征比较
Table 1. General data
例(%), X±S, M(P25, P75) 项目 SA组(92例) UA组(95例) t/χ2/Z P值 年龄/岁 66.20±10.68 68.18±9.71 -1.330 0.185 男性 53(57.5) 59(62.1) 0.393 0.531 高血压 53(57.6) 58(61.1) 0.230 0.632 高血糖 22(23.9) 36(37.9) 4.270 0.039 高血脂 37(40.2) 34(35.8) 0.389 0.533 吸烟史 36(39.1) 44(46.3) 0.986 0.321 饮酒史 24(26.1) 30(31.6) 0.686 0.407 甘油三酯/(mmol/L) 1.48(1.06,2.25) 1.41(1.11,2.13) -0.185 0.853 总胆固醇/(mmol/L) 4.66(3.89,5.26) 4.38(3.55,5.59) -0.597 0.550 低密度脂蛋白胆固醇/(mmol/L) 2.58(2.14,3.16) 2.64(1.91,3.19) -0.546 0.585 高密度脂蛋白胆固醇/(mmol/L) 1.30(1.09,1.50) 1.18(1.05,1.43) -1.542 0.127 血糖/(mmol/L) 5.50(5.11,6.35) 5.77(5.03,7.88) -1.388 0.165 HbA1c/(mmol/L) 6.38±1.06 6.79±1.72 -1.986 0.049 收缩压/mmHg 137.21±17.96 140.23±20.16 -1.082 0.281 舒张压/mmHg 81.05±11.98 80.38±11.95 0.386 0.700 高敏C反应蛋白/(mg/L) 2.85(1.50,5.83) 2.10(1.00,4.00) -1.698 0.089 高危斑块 31(33.7) 62(65.3) 18.630 < 0.010 管腔狭窄程度 2.845 0.241 轻 29(31.5) 20(21.1) 中 25(27.2) 27(28.4) 重 38(41.3) 48(50.5) 斑块位置 0.974 0.641 RCA 25(27.2) 29(30.5) LAD 59(64.1) 61(64.2) LCX 8(8.7) 5(5.3) 联合模型Rad-score 0.40±0.19 0.59±0.17 -6.873 < 0.01  下载: 导出CSV
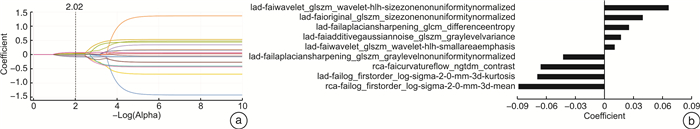
表 2 影像组学模型筛选出的影像组学特征、分类、滤波器及相关系数
Table 2. Image omics features, classification, filters and correlation coefficients screened by the image omics model
模型 影像组学特征名 影像组学分类 滤波器 系数 RCA模型 第90百分位数 一阶导数 拉普拉斯锐化 0.039 集群阴暗度 灰度共生矩阵 归一化 0.039 集群阴暗度 灰度共生矩阵 递归高斯 -0.011 低灰度区域强调 灰度相关矩阵 曲率流 -0.013 中值 一阶导数 高斯拉普拉斯算子
sigma-2.0-mm-三维-0.024 对比度 邻域灰度差矩阵 曲率流 -0.029 低灰度行程强调 灰度游程矩阵 曲率流 -0.030 强度 邻域灰度差矩阵 斑点噪声 -0.042 均值 一阶导数 高斯拉普拉斯算子
sigma-2.0-mm-三维-0.067 LAD模型 区域大小不均匀性 灰度大小区域矩阵 小波HLH变换 0.066 归一化区域大小不均匀性 灰度大小区域矩阵 拉普拉斯锐化 0.040 小面积强调 灰度大小区域矩阵 小波HHL变换 0.030 归一化区域大小不均匀性 灰度大小区域矩阵 原始 0.023 大依赖灰度强调 灰度相关矩阵 斑点噪声 0.018 归一化灰度不均匀性 灰度大小区域矩阵 拉普拉斯锐化 -0.002 归一化灰度不均匀性 灰度大小区域矩阵 加性高斯噪声 -0.019 相关信息测度1 灰度共生矩阵 盒子西格玛图像 -0.024 第10百分位数 一阶导数 拉普拉斯锐化 -0.024 峰度 一阶导数 高斯拉普拉斯算子
sigma-2.0-mm-三维-0.070 联合模型 LAD-归一化区域大小不均匀性 灰度大小区域矩阵 小波HLH变换 0.066 LAD-归一化区域大小不均匀性 灰度大小区域矩阵 原始 0.039 LAD-差熵 灰度共生矩阵 拉普拉斯锐化 0.025 LAD-灰度方差 灰度大小区域矩阵 加性高斯噪声 0.017 LAD-小面积强调 灰度大小区域矩阵 小波HLH变换 0.010 LAD-归一化灰度不均匀性 灰度大小区域矩阵 拉普拉斯锐化 -0.043 RCA-对比度 邻域灰度差矩阵 曲率流 -0.066 LAD-峰度 一阶导数 高斯拉普拉斯算子
sigma-2.0-mm-三维-0.070 RCA-均值 一阶导数 高斯拉普拉斯算子
sigma-2.0-mm-三维-0.089 注:RCA-:RCA近端PCAT特征;LAD-:LAD近端PCAT特征。
下载: 导出CSV
表 3 单因素分析及多因素logistic回归分析
Table 3. Univariate analysis and multivariate logistic regression analysis
变量 单因素分析 多因素logistic回归分析 t/χ2/Z P OR 95%CI P 糖尿病史 4.270 0.039 1.442 0.580~3.584 0.431 HbA1c -1.986 0.049 1.328 1.002~1.761 0.048 高危斑块 18.630 < 0.01 5.541 2.648~11.593 < 0.01 Rad-score -6.873 < 0.01 659.140 73.817~5 855.735 < 0.01
下载: 导出CSV
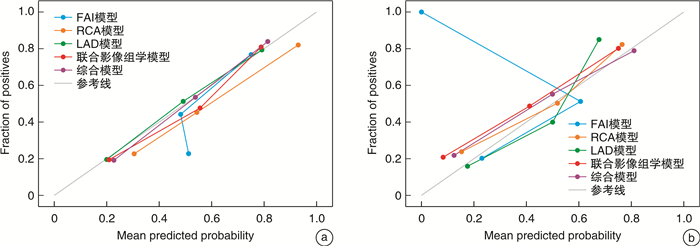
表 4 随机森林模型中FAI模型、影像组学模型及综合模型ROC曲线分析
Table 4. ROC curve analysis of FAI model, imagomics model and synthetic model in random forest model
模型类型 训练集(130例) 验证集(57例) AUC 特异度 灵敏度 符合率 平衡F分数 AUC 特异度 灵敏度 符合率 平衡F分数 随机森林 FAI模型 0.69(0.60~0.78) 0.55 0.71 0.63 0.66 0.55(0.40~0.71) 0.43 0.72 0.58 0.64 RCA模型 0.85(0.79~0.91) 0.83 0.69 0.76 0.74 0.76(0.63~0.89) 0.71 0.69 0.70 0.70 LAD模型 0.86(0.80~0.92) 0,63 0.85 0.74 0.76 0.78(0.66~0.90) 0.61 0.79 0.70 0.73 联合模型 0.86(0.80~0.92) 0.72 0.82 0.77 0.78 0.83(0.72~0.94) 0.71 0.90 0.81 0.83 综合模型 0.89(0.83~0.94) 0.74 0.80 0.77 0.78 0.85(0.75~0.96) 0.68 0.93 0.81 0.83 logistic回归 FAI模型 0.52(0.42~0.62) 0.55 0.54 0.55 0.54 0.49(0.33~0.64) 0.50 0.79 0.53 0.63 RCA模型 0.68(0.59~0.77) 0.69 0.54 0.62 0.58 0.74(0.61~0.87) 0.75 0.55 0.65 0.62 LAD模型 0.78(0.70~0.86) 0.66 0.75 0.71 0.72 0.70(0.56~0.84) 0.61 0.72 0.67 0.69 联合模型 0.75(0.67~0.84) 0.72 0.62 0.67 0.65 0.77(0.64~0.90) 0.71 0.79 0.75 0.77 综合模型 0.78(0.71~0.86) 0.66 0.72 0.69 0.70 0.83(0.72~0.94) 0.75 0.72 0.74 0.74
下载: 导出CSV
-
[1] Piątek Ł, Janion-Sadowska A, Piątek K, et al. Long-term clinical outcomes in patients with unstable angina undergoing percutaneous coronary interventions in a contemporary registry data from Poland[J]. Coron Artery Dis, 2020, 31(3): 215-221. doi: 10.1097/MCA.0000000000000812
[2] Fladseth K, Wilsgaard T, Lindekleiv H, et al. Outcomes after coronary angiography for unstable angina compared to stable angina, myocardial infarction and an asymptomatic general population[J]. Int J Cardiol Heart Vasc, 2022, 42: 101099.
[3] Writing Committee Members, Gulati M, Levy PD, et al. 2021 AHA/ACC/ASE/CHEST/SAEM/SCCT/SCMR Guideline for the Evaluation and Diagnosis of Chest Pain: A Report of the American College of Cardiology/American Heart Association Joint Committee on Clinical Practice Guidelines[J]. J Cardiovasc Comput Tomogr, 2022, 16(1): 54-122. doi: 10.1016/j.jcct.2021.11.009
[4] Al-lamee R, Thompson D, Dehbi HM, et al. Percutaneous coronary intervention in stable angina(ORBITA): a double-blind, randomised controlled trial[J]. Lancet, 2018, 391(10115): 31-40. doi: 10.1016/S0140-6736(17)32714-9
[5] Joshi PH, de Lemos JA. Diagnosis and management of stable angina: A Review[J]. JAMA, 2021, 325(17): 1765-1778. doi: 10.1001/jama.2021.1527
[6] Lin A, Nerlekar N, Yuvaraj J, et al. Pericoronary adipose tissue computed tomography attenuation distinguishes different stages of coronary artery disease: a cross-sectional study[J]. Eur Heart J Cardiovasc Imaging, 2021, 22(3): 298-306. doi: 10.1093/ehjci/jeaa224
[7] Bhatt DL, Lopes RD, Harrington RA. Diagnosis and treatment of acute coronary syndromes: A Review[J]. JAMA, 2022, 327(7): 662-675. doi: 10.1001/jama.2022.0358
[8] 闫芳, 刘杰, 廖红娟, 等. 血糖正常的老年高血压患者左心室重构与糖化血红蛋白的关系[J]. 临床心血管病杂志, 2022, 38(9): 716-9. https://lcxxg.whuhzzs.com/article/doi/10.13201/j.issn.1001-1439.2022.09.007
[9] Collet JP, Thiele H, Barbato E, et al. 2020 ESC Guidelines for the management of acute coronary syndromes in patients presenting without persistent ST-segment elevation[J]. Euro Heart J, 2021, 42(14): 1289-1367. doi: 10.1093/eurheartj/ehaa575
[10] Shang J, Ma S, Guo Y, et al. Prediction of acute coronary syndrome within 3 years using radiomics signature of pericoronary adipose tissue based on coronary computed tomography angiography[J]. Eur Radiol, 2022, 32(2): 1256-1266. doi: 10.1007/s00330-021-08109-z
[11] Oikonomou EK, Williams MC, Kotanidis CP, et al. A novel machine learning-derived radiotranscriptomic signature of perivascular fat improves cardiac risk prediction using coronary CT angiography[J]. Eur Heart J, 2019, 40(43): 3529-3543. doi: 10.1093/eurheartj/ehz592
[12] Si N, Shi K, Li N, et al. Identification of patients with acute myocardial infarction based on coronary CT angiography: the value of pericoronary adipose tissue radiomics[J]. Eur Radiol, 2022, 32(10): 6868-6877. doi: 10.1007/s00330-022-08812-5
[13] Knuuti J, Wijns W, Saraste A, et al. 2019 ESC Guidelines for the diagnosis and management of chronic coronary syndromes[J]. Euro Heart J, 2020, 41(3): 407-477. doi: 10.1093/eurheartj/ehz425
[14] Cury RC, Abbara S, Achenbach S, et al. CAD-RADS(TM)Coronary Artery Disease-Reporting and Data System. An expert consensus document of the Society of Cardiovascular Computed Tomography(SCCT), the American College of Radiology(ACR)and the North American Society for Cardiovascular Imaging(NASCI). Endorsed by the American College of Cardiology[J]. J Cardiovasc Com Tomo, 2016, 10(4): 269-281. doi: 10.1016/j.jcct.2016.04.005
[15] Yuvaraj J, Lin A, Nerlekar N, et al. Pericoronary adipose tissue attenuation is associated with high-risk plaque and subsequent acute coronary syndrome in patients with stable coronary artery disease[J]. Cells, 2021, 10(5): 1143. doi: 10.3390/cells10051143
[16] Li M, Ling R, Yu L, et al. Deep learning segmentation and reconstruction for CT of chronic total coronary occlusion[J]. Radiology, 2023, 306(3): e221393. doi: 10.1148/radiol.221393
[17] Yang W, Chen C, Yang Y, et al. Diagnostic performance of deep learning-based vessel extraction and stenosis detection on coronary computed tomography angiography for coronary artery disease: a multi-reader multi-case study[J]. Radiol Med, 2023, 128(3): 307-315. doi: 10.1007/s11547-023-01606-9
[18] Savargiv M, Masoumi B, Keyvanpour MR. A new random forest algorithm based on learning automata[J]. Comput Intell Neurosci, 2021, 2021: 5572781.
[19] Queiroz M, Sena CM. Perivascular adipose tissue in age-related vascular disease[J]. Ageing Res Rev, 2020, 59: 101040. doi: 10.1016/j.arr.2020.101040
[20] Klüner LV, Oikonomou EK, Antoniades C. Assessing cardiovascular risk by using the fat attenuation index in coronary CT Angiography[J]. Radiol Cardiothorac Imaging, 2021, 3(1): e200563. doi: 10.1148/ryct.2021200563
[21] Chen X, Dang Y, Hu H, et al. Pericoronary adipose tissue attenuation assessed by dual-layer spectral detector computed tomography is a sensitive imaging marker of high-risk plaques[J]. Quant Imaging Med Surg, 2021, 11(5): 2093-2103. doi: 10.21037/qims-20-860
[22] Oikonomou EK, Marwan M, Desai MY, et al. Non-invasive detection of coronary inflammation using computed tomography and prediction of residual cardiovascular risk(the CRISP CT study): a post-hoc analysis of prospective outcome data[J]. Lancet, 2018, 392(10151): 929-939. doi: 10.1016/S0140-6736(18)31114-0
[23] Mushenkova NV, Summerhill VI, Zhang D, et al. Current advances in the diagnostic imaging of atherosclerosis: insights into the pathophysiology of vulnerable plaque[J]. Int J Mol Sci, 2020, 21(8): 2838. doi: 10.3390/ijms21082838
[24] Thomsen C, Abdulla J. Characteristics of high-risk coronary plaques identified by computed tomographic angiography and associated prognosis: a systematic review and meta-analysis[J]. Eur Heart J Cardiovasc Imaging, 2016, 17(2): 120-129. doi: 10.1093/ehjci/jev325
[25] Antoniades C, Antonopoulos AS, Deanfield J. Imaging residual inflammatory cardiovascular risk[J]. Eur Heart J, 2020, 41(6): 748-758. doi: 10.1093/eurheartj/ehz474
[26] Su WY, Chen SC, Huang YT, et al. Comparison of the effects of fasting glucose, Hemoglobin A(1c), and triglyceride-glucose index on cardiovascular events in type 2 diabetes mellitus[J]. Nutrients, 2019, 11(11): 2838. doi: 10.3390/nu11112838
[27] Chen S, Shen Y, Liu YH, et al. Impact of glycemic control on the association of endothelial dysfunction and coronary artery disease in patients with type 2 diabetes mellitus[J]. Cardiovasc Diabetol, 2021, 20(1): 64. doi: 10.1186/s12933-021-01257-y
[28] Guo K, Zhao Q, Wang M, et al. The scope of hba1c variability and risk of vascular complications among patients with type 2 diabetes: a systematic review and meta-analysis of prospective studies[J]. Horm Metab Res, 2022, 54(2): 94-103. doi: 10.1055/a-1730-4904
[29] Dong X, Li N, Zhu C, et al. Diagnosis of coronary artery disease in patients with type 2 diabetes mellitus based on computed tomography and pericoronary adipose tissue radiomics: a retrospective cross-sectional study[J]. Cardiovasc Diabetol, 2023, 22(1): 14. doi: 10.1186/s12933-023-01748-0
-
图(3)
表(4)
计量
- 文章访问数: 1940
- PDF下载数: 955
- 施引文献: 0