
Relationship between the triglyceride-glucose index, pericoronary fat attenuation and coronary flow reserve
-
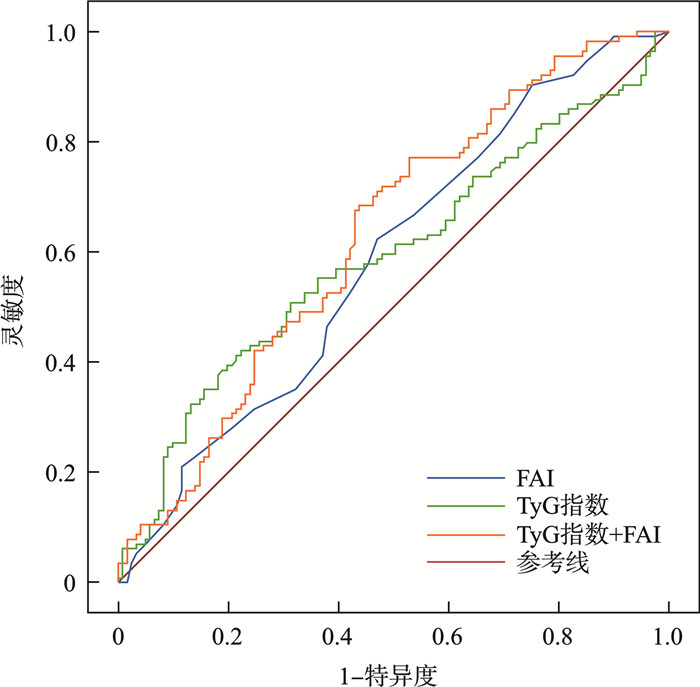
摘要: 目的 研究疑诊冠心病患者的甘油三酯-葡萄糖(TyG)指数、冠状动脉(冠脉)周围脂肪衰减指数(FAI)与CZT-SPECT测定的冠脉血流储备(CFR)之间的相关性。 方法 回顾性纳入1个月内先后行CCTA及CZT-SPECT检查的235例患者。收集患者的临床基线资料、心肌血流量(MBF)、CFR,并基于CCTA图像测定FAI。分别根据TyG指数和CFR值分组,比较2组间临床和影像学资料的差异,以logistic回归分析确定导致CFR减低的独立危险因素,采用ROC曲线评价TyG指数、FAI单独或联合诊断CFR减低的价值。 结果 TyG指数更高的患者整体静息MBF、负荷MBF和CFR均低于TyG指数低的患者。CFR减低组患者梗阻性病变发生率更高,TyG指数及FAI也更高。单因素logistic回归分析显示,吸烟史、TyG指数、梗阻性病变及FAI是CFR减低的独立危险因素。多因素logistic回归分析显示,仅有TyG指数(OR=1.621,P=0.017)及FAI(OR=1.037,P=0.042)与CFR减低相关。ROC曲线显示,TyG指数单一指标的曲线下面积(AUC)为0.591,联合FAI后AUC为0.628,差异无统计学意义(P=0.232)。 结论 TyG指数和FAI均是疑似冠心病患者CFR降低的独立预测因素。Abstract: Objective To investigate the relationship of the triglyceride-glucose(TyG) index, fat attenuation index(FAI) and coronary flow reserve(CFR) in suspected coronary artery disease(CAD) patients. Methods The data of 235 patients who underwent CCTA and CZT-SPECT within one month were retrospectively enrolled in this study. We collected clinical baseline data, MBF and CFR of patients and measured FAI based on CCTA. All patients were divided into two groups based on TyG index and CFR, respectively. Clinical and imaging parameters were compared by Mann Whitney Utest or independent sample ttest. The independent risk factors of reduced CFR were analyzed by the logistic regression analysis. ROC curve was used to evaluate the diagnosis value of TyG index alone or combined with FAI in CFR decreased. Results Patients with higher TyG index had lower rest MBF, stress MBF, and CFR compared to patients with lower TyG index. The incidence of obstructive lesions was higher in patients with reduced CFR, while TyG index and FAI were also higher compared to patients with normal CFR. Univariate logistic regression analysis showed that smoking history, TyG index, obstructive lesions and FAI were independent risk factors for reduced CFR. Multivariate logistic regression analysis showed that only TyG index(OR=1.621, P=0.017) and FAI(OR=1.037, P=0.042) were associated with reduced CFR. The area under the curve(AUC) of TyG index alone in identification of reduced CFR was 0.591. When it combined with FAI, the AUC was improved to 0.628 with no statistical significance(P=0.232). Conclusion The TyG index and FAI are independent predictive factors for reduced CFR in suspected CAD patients.
-

-
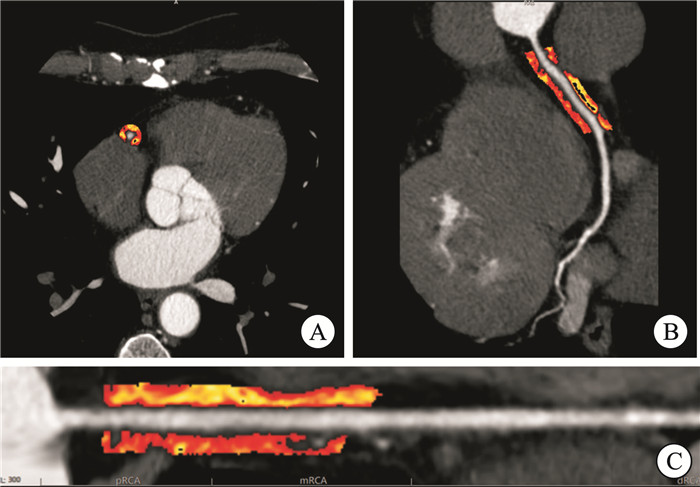
图 1 后处理软件半自动测量RCA的PCAT和FAI
Figure 1. Measurement of the adipose tissue volume and fat attenuation index surrounding the RCA
表 1 不同TyG指数的患者一般情况
Table 1. General data in patients with different TyG indexes
例(%), X±S, M(P25, P75) 项目 TyG指数≥8.70(118例) TyG指数 < 8.70(117例) P χ2 年龄/岁 59±10 61±11 0.199 男性 65(55) 59(50) 0.475 0.511 体重指数/(kg/m2) 26.2±3.7 25.1±3.4 0.012 高血压 73(62) 58(50) 0.058 3.598 高脂血症 55(47) 36(31) 0.013 6.213 糖尿病 35(30) 18(15) 0.009 6.855 吸烟史 41(35) 31(26) 0.170 1.882 家族史 17(15) 24(20) 0.217 1.521 空腹血糖/(mmol/L) 5.9(5.3,7.2) 5.1(4.7,5.5) < 0.001 总胆固醇/(mmol/L) 4.8(4.2,6.0) 4.3(3.6,5.1) < 0.001 甘油三酯/(mmol/L) 2.08(1.62,2.79) 0.95(0.74,1.22) < 0.001 高密度脂蛋白/(mmol/L) 1.15(0.96,1.28) 1.21(1.10,1.40) 0.001 低密度脂蛋白/(mmol/L) 3.07(2.45,3.86) 2.61(1.94,3.15) < 0.001 梗阻性病变 83(70) 67(57) 0.037 4.350 FAI/Hu -81.7±6.9 -80.7±8.7 0.350 PCAT体积/mm3 1840±347 1716±382 0.010 静息MBF/(mL/min/g) 0.80(0.74,0.84) 0.83(0.78,0.86) 0.001 负荷MBF/(mL/min/g) 1.85(1.40,2.42) 2.31(1.56,2.87) 0.003 CFR 2.47±0.84 2.74±0.95 0.021  下载: 导出CSV
表 2 CFR正常组和CFR减低组临床和影像学资料
Table 2. Clinical and imaging data in normal CFR group and decreased CFR group
例(%), X±S, M(P25, P75) 项目 CFR < 2.5(114例) CFR≥2.5(121例) P χ2 年龄/岁 59±11 61±10 0.179 男性 67(59) 57(47) 0.073 3.204 体重指数/(kg/m2) 25.9±3.2 25.4±3.9 0.290 高血压 69(61) 62(51) 0.152 2.052 高脂血症 42(37) 49(40) 0.566 0.330 糖尿病 29(25) 24(20) 0.304 1.055 吸烟史 42(37) 30(25) 0.045 4.010 家族史 24(21) 17(14) 0.157 1.999 空腹血糖/(mmol/L) 5.6(4.9,6.4) 5.4(5.0,6.1) 0.378 总胆固醇/(mmol/L) 4.8(4.1,5.6) 4.4(3.8,5.4) 0.140 甘油三酯/(mmol/L) 1.49(0.98,2.45) 1.29(0.87,1.85) 0.012 高密度脂蛋白/(mmol/L) 1.17(1.02,1.33) 1.21(1.05,1.36) 0.125 低密度脂蛋白/(mmol/L) 2.92(2.13,3.60) 2.71(2.09,3.49) 0.173 TyG指数 8.90(8.31,9.37) 8.65(8.24,9.04) 0.015 梗阻性病变 81(71) 69(57) 0.025 5.003 FAI/Hu -80.0±7.0 -82.2±8.5 0.024 PCAT体积/mm3 1740±374 1814±362 0.129 静息MBF/(mL/min/g) 0.79(0.73,0.84) 0.83(0.78,0.86) < 0.001 负荷MBF/(mL/min/g) 1.47(1.23,1.72) 2.58(2.32,3.14) < 0.001
下载: 导出CSV
表 3 CFR减低的回归分析
Table 3. Regression analysis of CFR reduction
因素 单因素logistic回归分析 多因素logistic回归分析 OR P OR P 年龄 0.983 0.179 男性 1.602 0.074 体重指数 1.040 0.290 高血压 1.459 0.153 高脂血症 0.857 0.566 糖尿病 1.379 0.305 吸烟史 1.769 0.046 1.524 0.157 家族史 1.631 0.160 TyG 1.623 0.013 1.621 0.017 梗阻性病变 1.850 0.026 1.537 0.135 FAI 1.039 0.025 1.037 0.042 PCAT体积 0.999 0.129
下载: 导出CSV
-
[1] Hill MA, Yang Y, Zhang LP, et al. Insulin resistance, cardiovascular stiffening and cardiovascular disease[J]. Metabolism, 2021, 119: 154766. doi: 10.1016/j.metabol.2021.154766
[2] 李晓乐, 谢丽响, 严卉, 等. 冠周脂肪及甘油三酯-葡萄糖指数对不同类型心房颤动射频消融术后复发的预测价值[J]. 临床心血管病杂志, 2024, 40(8): 669-674. doi: 10.13201/j.issn.1001-1439.2024.08.013
[3] Qiu X, Aimaiti G, Chen YL, et al. Associations of TyG index with coronary heart disease risk and coronary artery sclerosis severity in OSA[J]. Diabetol Metab Syndr, 2024, 16(1): 301. doi: 10.1186/s13098-024-01545-z
[4] Oikonomou EK, Marwan M, Desai MY, et al. Non-invasive detection of coronary inflammation using computed tomography and prediction of residual cardiovascular risk(the CRISP CT study): a post-hoc analysis of prospective outcome data[J]. Lancet, 2018, 392(10151): 929-939. doi: 10.1016/S0140-6736(18)31114-0
[5] Chen MY, Liu B, Li X, et al. Relationship between peri-coronary inflammation and coronary vascular function in patients with suspected coronary artery disease[J]. Front Cardiovasc Med, 2024, 11: 1303529. doi: 10.3389/fcvm.2024.1303529
[6] 崔利军, 于朋伟, 田刚, 等. CZT-SPECT测定心肌血流量和血流储备对冠状动脉重度狭窄的预测价值[J]. 临床心血管病杂志, 2023, 39(2): 129-134. doi: 10.13201/j.issn.1001-1439.2023.02.011
[7] Dong MY, Jiang HY, Wang YY, et al. Gelanxinning capsule improves coronary microvascular dysfunction by inhibiting inflammation and restoring endothelial function[J]. Eur Rev Med Pharmacol Sci, 2023, 27(18): 8579-8587.
[8] Tian X, Zuo YT, Chen SH, et al. Triglyceride-glucose index is associated with the risk of myocardial infarction: an 11-year prospective study in the Kailuan cohort[J]. Cardiovasc Diabetol, 2021, 20(1): 19. doi: 10.1186/s12933-020-01210-5
[9] Wang J, Li S, Chen WQ, et al. Diagnostic efficiency of quantification of myocardial blood flow and coronary flow reserve with CZT dynamic SPECT imaging for patients with suspected coronary artery disease: a comparative study with traditional semi-quantitative evaluation[J]. Cardiovasc Diagn Ther, 2021, 11(1): 56-67. doi: 10.21037/cdt-20-728
[10] Zhang X, Li H, Wu P, et al. The diagnosis and prognosis of coronary microvascular disease using PET/CT[J]. Clin Hemorheol Microcirc, 2022, 80(2): 153-166. doi: 10.3233/CH-201034
[11] Mone P, De Gennaro S, Moriello D, et al. Insulin resistance drives cognitive impairment in hypertensive pre-diabetic frail Elders: the CENTENNIAL study[J]. Eur J Prev Cardiol, 2023, 30(12): 1283-1288. doi: 10.1093/eurjpc/zwad173
[12] Wang ST, Shi ZZ, Pan H, et al. Triglyceride glucose index is associated with functional coronary artery stenosis in hypertensive patients[J]. Front Endocrinol(Lausanne), 2024, 15: 1323722. doi: 10.3389/fendo.2024.1323722
[13] Lee EY, Yang HK, Lee J, et al. Triglyceride glucose index, a marker of insulin resistance, is associated with coronary artery stenosis in asymptomatic subjects with type 2 diabetes[J]. Lipids Health Dis, 2016, 15(1): 155. doi: 10.1186/s12944-016-0324-2
[14] Yu BY, Mo YH, Hu XM, et al. Triglyceride-glucose index is associated with quantitative flow ratio in patients with acute ST-elevation myocardial infarction after percutaneous coronary intervention[J]. Front Cardiovasc Med, 2022, 9: 1002030. doi: 10.3389/fcvm.2022.1002030
[15] Jia G, Bai H, Mather B, et al. Diabetic vasculopathy: molecular mechanisms and clinical insights[J]. Int J Mol Sci, 2024, 25(2): 804. doi: 10.3390/ijms25020804
[16] Guaricci AI, Neglia D, Acampa W, et al. Computed tomography and nuclear medicine for the assessment of coronary inflammation: clinical applications and perspectives[J]. J Cardiovasc Med(Hagerstown), 2023, 24(Suppl 1): e67-e76.
[17] Farag SI, Mostafa SA, El-Rabbat KE, et al. The relation between pericoronary fat thickness and density quantified by coronary computed tomography angiography with coronary artery disease severity[J]. Indian Heart J, 2023, 75(1): 53-58. doi: 10.1016/j.ihj.2023.01.006
-
计量
- 文章访问数: 23
- 施引文献: 0